DIGITAL ANALYTICS & HOW TO ENGAGE WITH US ON SOCIAL MEDIA
Social Media Strategy 2025/26
In 2024, we made a strategic decision to reduce our investment in social media. This included scaling back our use of user-generated content (UGC) and shifting focus toward curated posts that highlight the Similkameen Valley’s core attributes. We have seen increases in followers while reallocating funds to other initiatives.
For 2025, our social media strategy continues to evolve. The launch of our new seasonal blog series—starting with Summer and Fall has become a central call to action across our Meta campaigns and select social posts. Rather than prioritizing volume or follower growth, our goal is to drive qualified traffic to our website through engaging, original content that links back to specific landing pages. These blogs are designed to interlink with internal pages, helping improve SEO and user experience.
Our social media content is less focused on UGC and more on storytelling, strategic community tagging, and featuring local businesses and experiences. We have not observed a decline in overall metrics as a result of this shift; in fact, initial indicators suggest strong performance aligned with our traffic and conversion goals.
We continue to use the #ExploreBC hashtag to align with Destination BC’s amplification efforts and ensure our content is searchable through their networks. However, due to recent changes in how Meta platforms handle hashtags, we have reduced our use of them overall. Instead, we optimize captions using relevant search terms and enhance accessibility and discoverability through descriptive alt text.
Engaging with Partners:
We encourage our regional partners to engage with us by:
- Sharing and resharing our blog content and social posts where relevant
- Tagging @similkameenvalley #SimilkameenValley in their own posts to help us see and amplify local stories
- Using the #ExploreBC hashtag when promoting regional experiences to support Destination BC visibility
- Coordinating on seasonal campaigns to align messaging and cross-promote events or features
Help amplify the Similkameen Valley digital presence, as well as your own! We can elevate each other’s channels and content to gain more exposure than operating alone.
- Follow @similkameenBC on Facebook and Instagram
- Tag @similkameenBC when posting relevant content
Like, comment, and share on other social media accounts from businesses in the Similkameen Valley. The higher the number of interactions, the higher the post’s visibility. Help your neighbour!
This integrated approach allows us to remain discoverable, support community partners, and ensure our content serves both tourism and economic development goals.This integrated approach allows us to remain discoverable, support community partners, and ensure our content serves both tourism and economic development goals.
General Overview – Website and Social Channels
The website is the main marketing asset for the Similkameen Valley. Social media accounts are secondary. Year-to-date indicators show the website is still of interest to users, and social media users are still on the rise. Direct year-over-year comparisons are not possible due to algorithm and other changes by the providers. The following is for general information.

The last fiscal year baseline is used for general comparison only with annual key indicators, which are presented by the reporting period April 1, 2024 to March 31, 2025, which coincides with the Destination BC Cooperative funding cycle and reporting requirements. Both the website and social media channels are stable in the usage numbers, and growth is indicated when funds are applied to the promotion of them.

Website Metrics April 1, 2024 to March 31, 2025 – Annual Summary
The annual summary is updated every April to coincide with Destination BC funding and reporting cycle.
The website usage is consistent with more than 44,000 users per year, with increased usage as high as over 55,000 when digital campaigns are activated. Our audience is mostly from BC and are new users. Top cities: Vancouver, Kelowna, Surrey, Osoyoos, Penticton and Princeton. Peak use of the website is June/July/August, with July being the highest. Organic search is our number one source, accounting for 80% of website visits. Direct visitations follow as the second largest source, generating 12% of the website’s traffic. The website generated over 96,315 page views, with the home page being the most visited, which has been consistent over time. There are over 9,000 website click-throughs.

Mobile device users make up 57%, and desktop users make up 36%. Of those reporting the balance of female and male is fairly even. The majority of users’ age is unknown but of those reporting they rank from highest volume 25-34, 45-54, 55-64, followed by 35-44, 65+, 18-24. Our website attracts a diverse audience, drawing the majority of its traffic from British Columbia, followed by Alberta, with some international interest. They are travel buffs, avid readers of news, entertainment, and they enjoy food & cooking.
Social Media Metrics April 1, 2024 to March 31, 2025 – Annual Summary
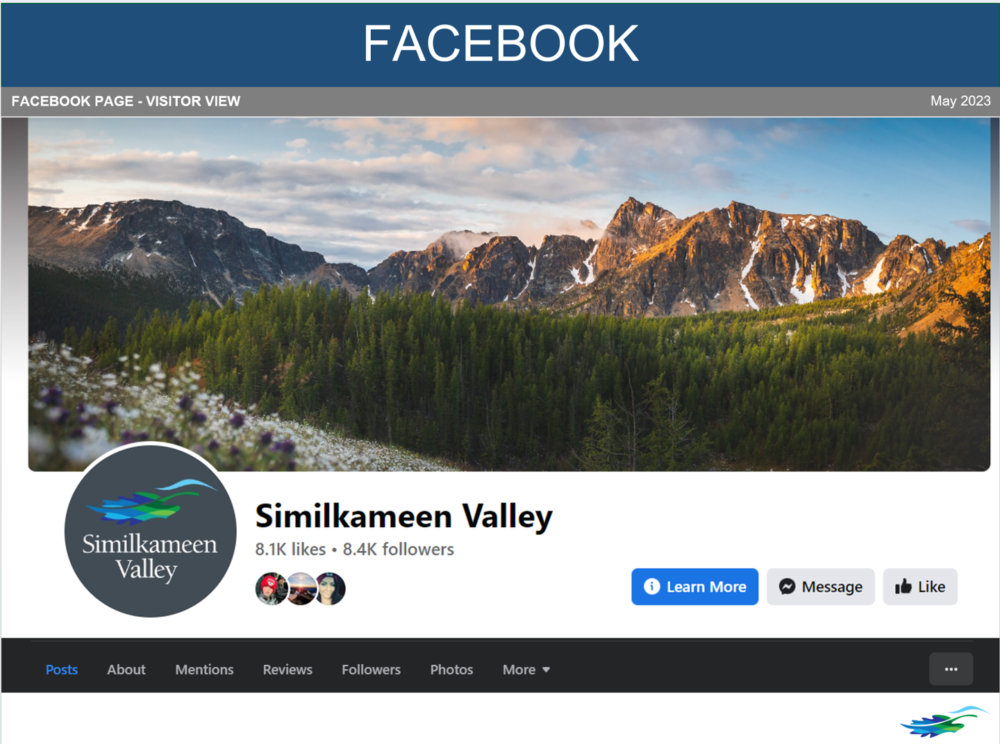
Facebook saw a slight decrease in followers to 9,100. This channel continues to resonate with demographics over 25 years of age, with 28.2% of the audience being age 65+. The main audience is local British Columbia residents with some followers from Alberta and a small portion of followers coming from the United States. Total reach 236,714, impressions 384,821 with total engagement of 6,652 and 352 post clicks resulting in 3.7%.
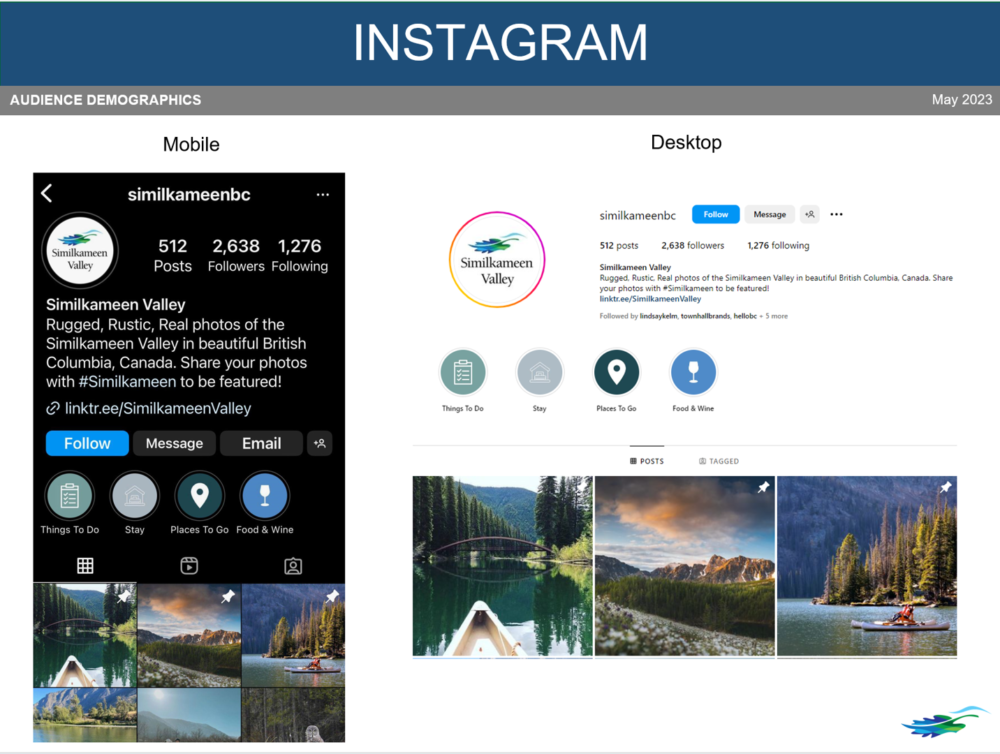
Instagram followers are up to 3,084. This channel reaches a slightly different demographic with 32% of followers being between 35-44 years of age and 23.8% between 25-34 years old, with followers continuing to be BC and Alberta residents. Total reach 17,552, total impressions 34,871 with 2,425 engagements.
Consumer Emails
Introduced in Fall 2024 we launched the first consumer newsletter followed by a winter 2024/25 newsletter. As the majority of our website users are new, we aim to capture their attention by encouraging them to subscribe to our seasonal newsletter, which will keep them up-to-date with the latest trip ideas. Want to receive the consumer newsletter? Opt in here.
Check out our newsletters (Fall 2024) + (Winter 24/25), Spring 2025, Summer 2025, Fall 2025 and Winter 2025/26.


digital campaign HISTORY
Spring 2024 META Campaign

Spring 2024 META Campaign Highlights Facebook and Instagram March 1-20th, 2024. The primary landing pages included the SimikameenValley.com website pages: Things-to-do-Outdoor-activities, Top-5-Hiking-Spots, and Things-to-Do. The top 5 locations targeted were Vancouver, Kelowna, Penticton, Kamloops, and Surrey. The campaign resulted in the highest website user volume for the year during the campaign month. Landing page views: 5,705 Post engagements: 1,371 Individual clicks on external websites: 415 Clicks on business details: 100 Total Impressions: 510,090 Total unique reach: 205,588 Engagements: 7,364.
Digital campaigns for 2021, 2022, 2023, and 2024 are in partnership with the Crownest Tourism Alliance. This allows leveraging of the budget for broader reach. Refer to the Crowsnest page for more information.
The Similkameen Valley launched its first dedicated digital display campaign in the fall of 2020 with 4,835,360 impressions. Utilizing the visitor research data from those who had stayed overnight in the Regional District Okanagan Similkameen in 2019, they were targeted along with new market segments for the BC campaign. 6,913 ad clicks resulted in 2,000+ click-throughs to the campaign landing page, which ultimately led to the official travel website similkameenvalley.com
For more information contact support@similkameenvalley.com