DIGITAL ANALYTICS & HOW TO ENGAGE WITH US ON SOCIAL MEDIA
General Overview – Website and Social Channels
The website is the main marketing tool for the Similkameen Valley. Social media channels support the website.
For the closing fiscal year, the website continues to see strong interest from users, with growth trends supported by digital advertising, and social media engagement is also increasing.
It isn’t possible to make direct year-over-year as digital platforms regularly change their algorithms and reporting methods. The information below is shared for general context only.
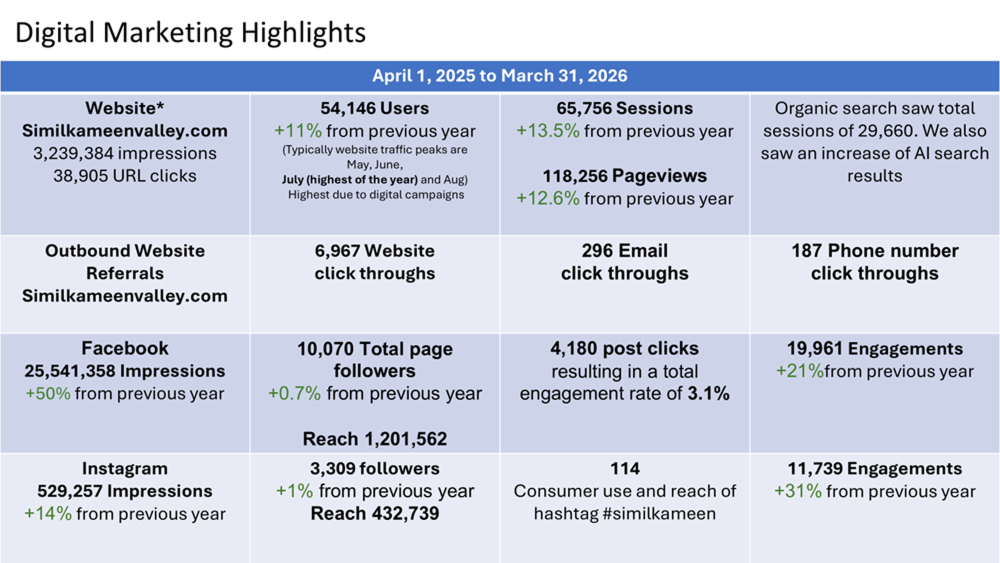
Website Metrics April 1, 2025 to March 31, 2026 – Annual Summary
The annual summary is updated every April to coincide with Destination BC funding and reporting cycle.
- Website traffic grew across the board: 54,146 users (+11%), 65,756 sessions (+13.5%), and 118,256 pageviews (+12.6%) for the fiscal year
- The website generated 3.2M impressions and 38,905 URL clicks from April 2025 to March 2026
- The site successfully drove referral traffic to local businesses. 6,967 website clicks, 296 email clicks, and 187 phone number clicks
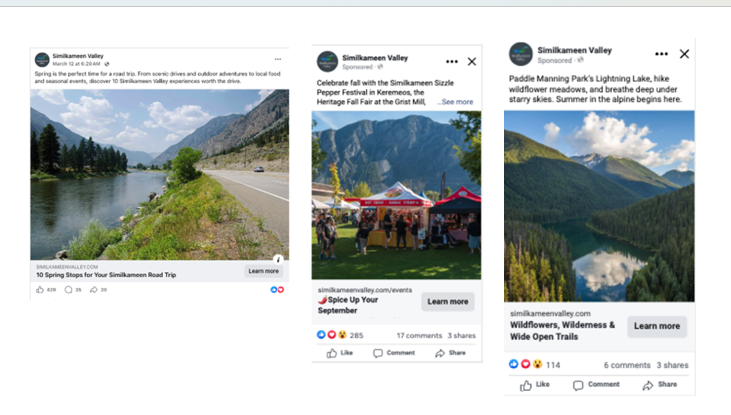
- Seasonal blog content continued to drive the most website traffic – the Spring and Summer blogs were the top two most viewed pages (which had advertising support)
- AI-driven search referrals were noted as a new and emerging traffic source for the first time this fiscal year
- Top Pages Viewed: Spring Blog, home page, Summer Blog, events page and floating.
- Top Audience locations: Vancouver, Surrey, Osoyoos and Penticton.
- Top Traffic Sources: Organic, Direct, Paid Social and Google Ads.
- Top Devices: Mobile followed by desktop.

Social Media Strategy
In 2024, we made a strategic decision to reduce our investment in social media, which included scaling back our dependency on user-generated content (UGC) and shifting focus toward curated posts that highlight the Similkameen Valley’s core attributes. We have seen continuous increases in followers while reallocating funds to other initiatives.
For 2025, we introduced our four seasonal blogs as the main call-to-action for digital ads and select social posts. Rather than prioritizing volume or follower growth, our goal is to drive qualified traffic to our website through engaging, original content that links back to specific landing pages. These blogs are designed to interlink with internal pages, helping improve SEO and user experience.
For 2026, our social media content continues to be less focused on UGC and more on storytelling, strategic community tagging, and featuring local businesses and experiences. We have not observed a decline in overall metrics as a result of this shift; in fact, this past year’s indicators suggest strong performance aligned with our traffic and conversion goals.
We continue to use the #ExploreBC hashtag to align with Destination BC’s amplification efforts and ensure our content is searchable through their networks. However, due to recent changes in how Meta platforms handle hashtags, we have reduced our use of them overall. Instead, we optimize captions using relevant search terms and enhance accessibility and discoverability through descriptive alt text.
Engaging with Partners:
We encourage our regional partners to engage with us by:
- Sharing and resharing our blog content and social posts where relevant
- Tagging @similkameenvalley #SimilkameenValley in their own posts to help us see and amplify local stories
- Using the #ExploreBC hashtag when promoting regional experiences to support Destination BC visibility
- Coordinating on seasonal campaigns to align messaging and cross-promote events or features
Help amplify the Similkameen Valley digital presence, as well as your own! We can elevate each other’s channels and content to gain more exposure than operating alone.
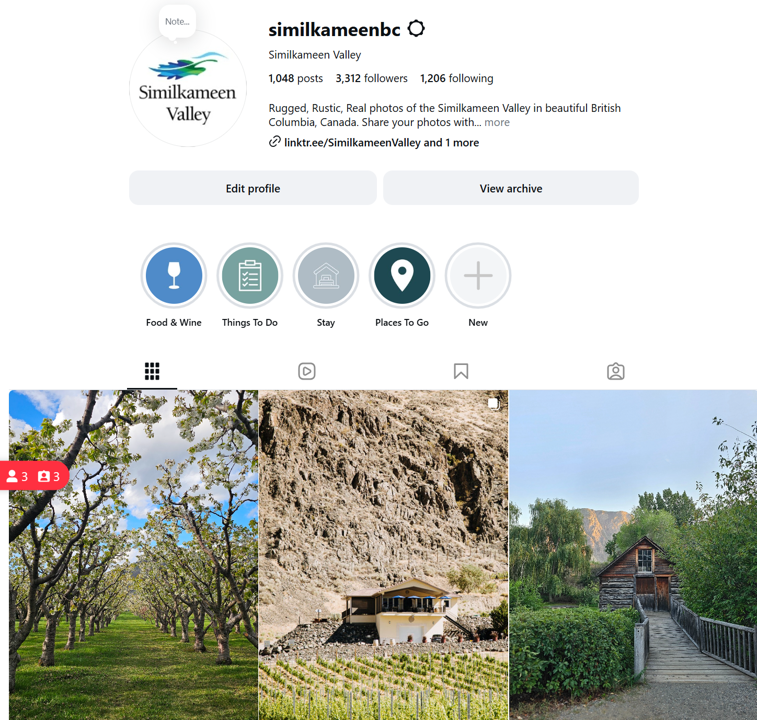
- Follow @similkameenBC on Facebook and Instagram
- Tag @similkameenBC when posting relevant content
Like, comment, and share on other social media accounts from businesses in the Similkameen Valley. The higher the number of interactions, the higher the post’s visibility. Help your neighbour!
This integrated approach allows us to remain discoverable, support community partners, and ensure our content serves both tourism and economic development goals.
Social Media Highlights April 1, 2025 to March 31, 2026
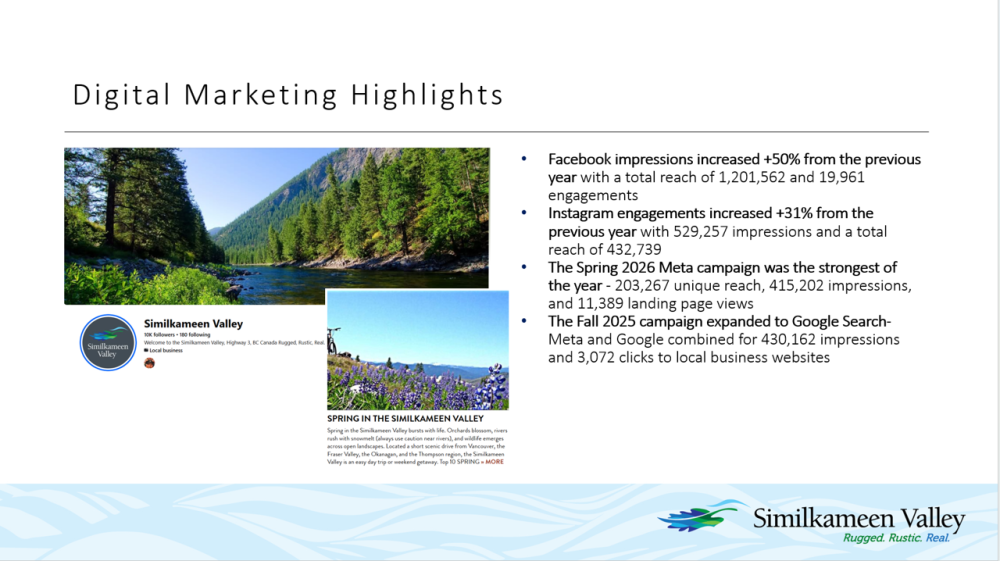
Facebook saw an increase in followers, bringing the total number of followers to 10,070.
Total reach 1,201,562
Total impressions were 25,541,358 with total engagement and link clicks of 19,961, resulting in a total engagement rate of 3.1%
Facebook continues to resonate with demographics over 25 years of age, with 20.4% of the audience being age 35-44.
The main audience is local British Columbia residents with some followers from Alberta, and a small portion of followers coming from the United States
Instagram saw a +1% follower increase, with the total followers at 3,309
Total reach 432,739
Total impressions on content were 529,257, with 11,739 engagements
The images to the right show the top-performing posts
Instagram reaches a slightly different demographic, with 30.3% of followers being between 35-44 years of age and 23.8% between 25-34 years old
Followers continue to be BC and Alberta residents
Consumer Emails
Introduced with the fall 2024 issue, we distribute four seasonal consumer newsletters each year. The majority of website users are new, so we encourage subscriptions so they can stay informed with the latest trip ideas and updates.
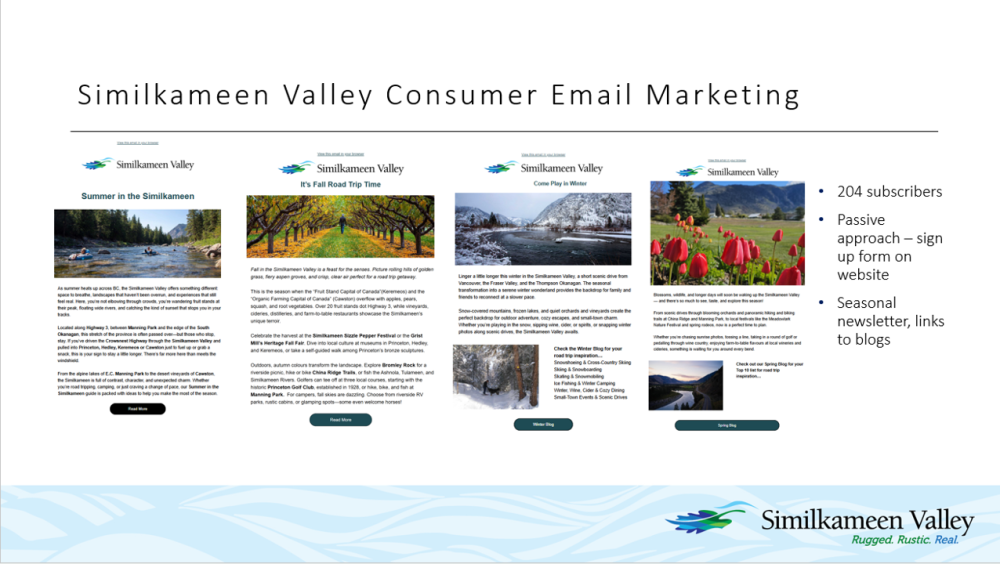
Current subscriber numbers are 204. Growth has been slow to date, and the current approach is passive, relying mainly on a website pop-up to encourage sign-ups.
Want to receive the consumer newsletter? Opt in here.
Check out our newsletters: Spring 2025, Summer 2025, Fall 2025, Winter 2025/26, Spring 2026.
Digital Campaign Highlights
Spring 2026 Digital Campaign Highlights
- The goal was to build top-of-funnel awareness of the spring blog, ultimately driving traffic to the website
- The spring campaign ran on Facebook and Instagram from March 1 – 28, 2026. The primary landing page for this campaign was the spring blog.
- The website had high organic traffic for the summer, with additional website traffic from this campaign.
- The top 3 locations targeted were British Columbia, Alberta and Washington State
- Meta Landing page views: 11,389
- Meta Post engagements: 13,522
- Google Link Clicks: 607
- Individual clicks on external websites: 677
- Clicks on business details: 21
- Meta Total Impressions: 415,202
- Meta Total unique reach 203,267
- Google Total Impressions: 12,678
Fall 2025 Digital Campaign Highlights
- The goal was to build top-of-funnel awareness of the fall blog, ultimately driving traffic to the website
- The Fall campaign ran on Facebook, Instagram and Google Search from September 11-29, 2025. The primary landing page for this campaign was the fall blog.
- The website had high organic traffic for the summer, with additional website traffic from this campaign.
- The top 3 locations targeted were British Columbia, Alberta and Washington State
- Meta Landing page views: 7,910
- Meta Post engagements: 9,080
- Google Landing page views: 1,687
- Individual clicks on external websites: 3,072
- Clicks on business details: 317
- Meta Total Impressions: 371,773
- Meta Total unique reach 160,606
- Google Total Impressions: 58,389
Summer 2025 Digital Campaign Highlights
- The goal was to build top-of-funnel awareness of the summer blog, ultimately driving traffic to the website
- The Summer campaign ran on Facebook and Instagram July 7 – August 1, 2025. The primary landing page for this campaign was the summer blog:
- The website had high organic traffic for the summer, with additional website traffic from this campaign.
- The top 5 locations targeted were Vancouver, Kelowna, Penticton, Kamloops and Surrey
- Landing page views: 4,249
- Post engagements: 5,311
- Individual clicks on external websites: 1,349
- Clicks on business details: 82
- Total Impressions: 220,580
- Total unique reach 82,928
digital campaign HISTORY
Spring 2024 META Campaign

Spring 2024 META Campaign Highlights Facebook and Instagram March 1-20th, 2024. The primary landing pages included the SimikameenValley.com website pages: Things-to-do-Outdoor-activities, Top-5-Hiking-Spots, and Things-to-Do. The top 5 locations targeted were Vancouver, Kelowna, Penticton, Kamloops, and Surrey. The campaign resulted in the highest website user volume for the year during the campaign month. Landing page views: 5,705 Post engagements: 1,371 Individual clicks on external websites: 415 Clicks on business details: 100 Total Impressions: 510,090 Total unique reach: 205,588 Engagements: 7,364.
Digital campaigns for 2021, 2022, 2023, and 2024 are in partnership with the Crownest Tourism Alliance. This allows leveraging of the budget for broader reach. Refer to the Crowsnest page for more information.
The Similkameen Valley launched its first dedicated digital display campaign in the fall of 2020 with 4,835,360 impressions. Utilizing the visitor research data from those who had stayed overnight in the Regional District Okanagan Similkameen in 2019, they were targeted along with new market segments for the BC campaign. 6,913 ad clicks resulted in 2,000+ click-throughs to the campaign landing page, which ultimately led to the official travel website similkameenvalley.com
For more information contact support@similkameenvalley.com